

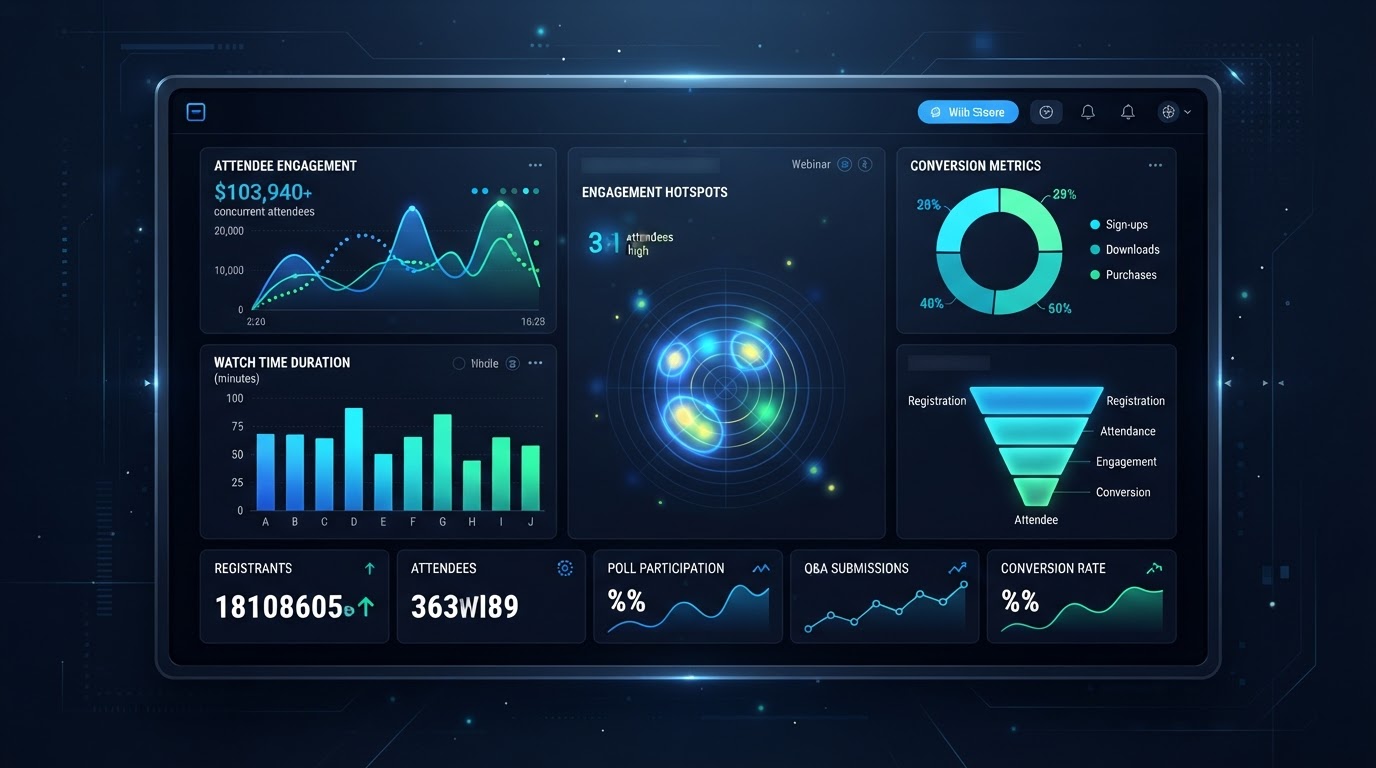
The metrics most businesses track for webinars — registration count and attendance rate — are the least useful for predicting revenue. They tell you how many people showed up. They do not tell you whether those people will buy. A webinar with 500 registrations and 200 attendees that generates 0 customers is not successful. A webinar with 50 registrations and 20 attendees that generates 5 customers is.
The metrics that predict conversion are behavioral. They measure what attendees did during the webinar, not just whether they attended. These metrics tell you who is interested, how interested they are, and what they are likely to do next. Here are the ones that matter.
Engagement metrics
Engagement metrics measure active participation during the webinar. These are the strongest predictors of conversion because they signal genuine interest — not just passive viewing.
- Watch time — how long the attendee stayed. Full viewers convert at significantly higher rates than partial viewers. Track the distribution of watch times, not just the average.
- Questions asked — whether the attendee engaged with the chat. An attendee who asks a question is signaling active interest. Track both the number of questions and the content — what they ask about tells you what they care about.
- Poll participation — whether the attendee responded to polls. Polls are low-friction engagement that signals the attendee is paying attention, not just listening in the background.
- Offer clicks — whether the attendee clicked the call-to-action. This is the strongest behavioral signal of intent. An offer click means the attendee wanted to act.
These metrics, taken together, create an intent score for each attendee. An attendee who watched 90%, asked two questions, and clicked the offer is a high-intent lead. An attendee who watched 10% and did nothing else is a low-intent lead. The intent score determines the follow-up — not a form field, not a self-reported qualification, but actual behavior.
Funnel conversion metrics
Funnel metrics track the attendee's journey from registration to revenue. Each stage has a conversion rate, and each rate tells you where the funnel leaks.
- Registration-to-attendance rate — what percentage of registrants actually attended. A low rate means the gap between registration and session is too long, or the reminders are not effective.
- Attendance-to-engagement rate — what percentage of attendees actively engaged (watched most of the session, asked questions, clicked polls). A low rate means the presentation is not holding attention.
- Engagement-to-offer rate — what percentage of engaged attendees clicked the offer. A low rate means the offer is not compelling or the presentation did not build enough desire.
- Offer-to-conversion rate — what percentage of offer-clickers completed the desired action (booking, trial, purchase). A low rate means friction or unaddressed objections are stopping conversion.
Each metric points to a specific problem. Registration-to-attendance is a timing problem. Attendance-to-engagement is a content problem. Engagement-to-offer is an offer problem. Offer-to-conversion is a friction problem. By tracking each rate, you know exactly which lever to optimize.
Registration count and attendance rate tell you how many people came. Engagement and funnel metrics tell you what they did and whether they will buy. Track both — but optimize based on the behavioral metrics, not the vanity ones.
Drop-off analysis
Drop-off analysis tracks when attendees leave the webinar. If 40% of attendees drop off at minute 12, something at minute 12 is losing them. Maybe the section is too long, too technical, or not relevant. The drop-off point tells you exactly where to restructure the presentation.
This is one of the most actionable analytics a webinar can provide. Unlike aggregate metrics, drop-off analysis points to a specific moment in the presentation. Fix that moment, and the retention curve changes. The attendees who would have dropped off at minute 12 stay — and the downstream conversion metrics improve.
The metric that matters most
If you could track only one metric, it would be cost per qualified lead — the total cost of the webinar (production, promotion, ad spend) divided by the number of qualified leads generated. A qualified lead is an attendee who demonstrated high intent through behavior: watched most of the session, engaged with the chat, or clicked the offer.
This metric connects the webinar to revenue. It tells you whether the webinar is an efficient lead generation tool or an expensive one. And it allows you to compare the webinar against other channels — paid ads, content marketing, events — on the same basis. A webinar with a lower cost per qualified lead than your paid ads is a channel worth scaling. One with a higher cost is a channel worth optimizing before scaling.
See AI webinars in action
Watch how WebinarBoostAi creates, presents, and engages with webinars using AI.
Book A DemoFrequently Asked Questions
What webinar metrics should I track?
Track engagement metrics (watch time, questions asked, poll participation, offer clicks), funnel conversion rates (registration-to-attendance, attendance-to-engagement, engagement-to-offer, offer-to-conversion), and drop-off points. These behavioral metrics predict conversion far better than registration count or attendance rate.
What is the most important webinar metric?
Cost per qualified lead — total webinar cost divided by the number of high-intent attendees (those who watched most of the session, engaged with chat, or clicked the offer). This connects the webinar to revenue and allows comparison against other lead generation channels.
How do I measure webinar engagement?
Track watch time distribution, questions asked, poll participation, and offer clicks. Taken together, these create an intent score for each attendee. High-intent attendees (full viewers who asked questions and clicked the offer) convert at significantly higher rates than low-intent ones.
What is drop-off analysis in webinars?
Drop-off analysis tracks when attendees leave the webinar. If 40% drop off at minute 12, something at that point is losing them. Unlike aggregate metrics, drop-off points to a specific moment in the presentation to fix — making it one of the most actionable analytics available.
Why are registration count and attendance rate not enough?
They tell you how many people came, not whether they will buy. A webinar with 500 registrations and 0 customers is not successful. Behavioral metrics — engagement, offer clicks, funnel conversion — predict revenue. Track both, but optimize based on the behavioral metrics.